The Default GA4 Reports Are Only the Starting Point
Open GA4 for the first time and you get a set of standard reports. They cover traffic, engagement, user acquisition, and conversions. They are useful, but they answer general questions. Most businesses soon want something sharper, like which blog posts bring in enquiries, which campaigns drive sales, or how mobile visitors behave differently from desktop ones.
That is where custom reports come in. They let you shape the data around your own questions, so the numbers you check every week actually match the decisions you make.
Three Ways to Build Custom Views in GA4
GA4 gives you a few routes to a custom view, and it helps to know which one fits your need.
The first is the Library. It lets you edit the standard reports, rename them, change the cards on them, and reorder the sections. This is the quickest way to tidy up the default reports so your team sees what matters first.
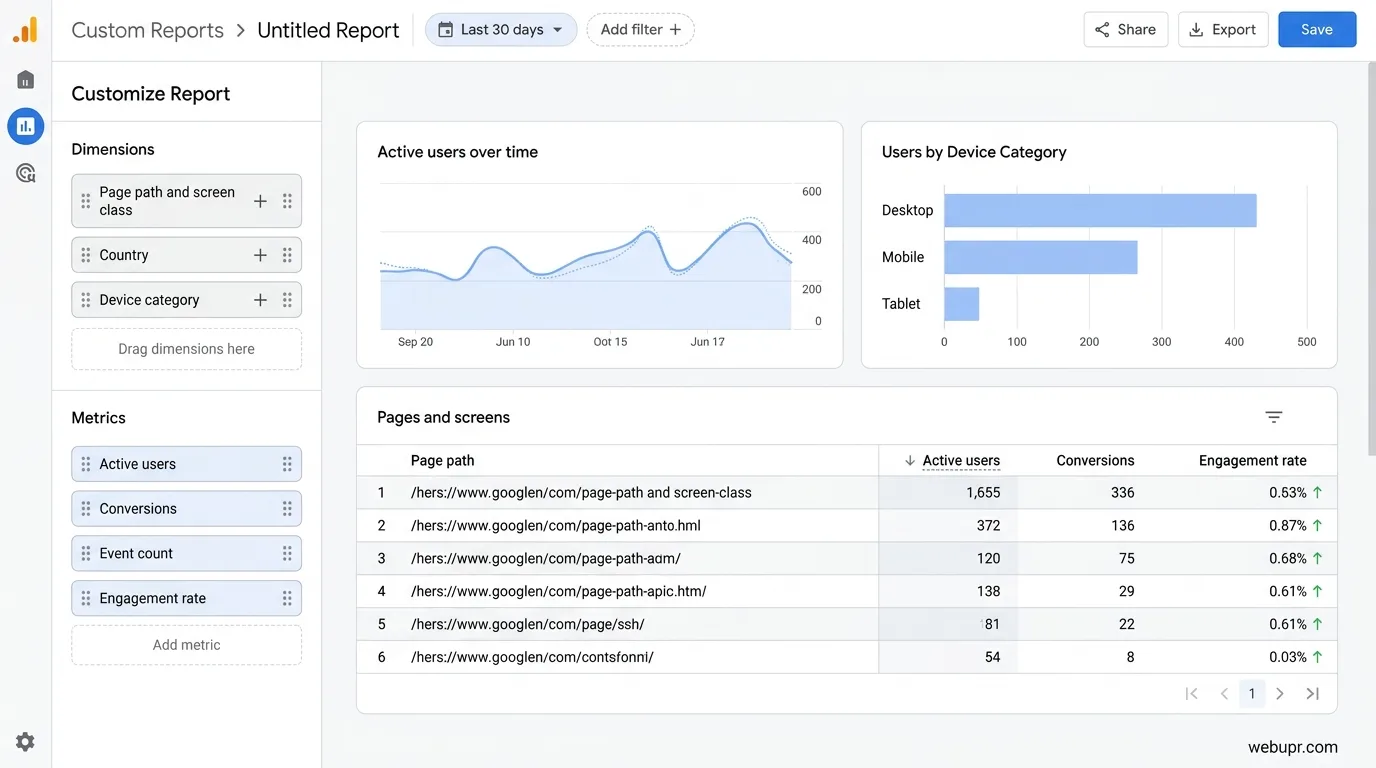
The second is the Explore section. Explorations let you build free-form analysis with dimensions and metrics you choose yourself. You can drag fields into rows and columns, add filters, and compare segments. This is the most flexible option and the one most people end up using for deeper questions.
The third is custom dimensions and metrics. These are fields you define yourself, based on event parameters your site sends. They make your own data available in reports, but they need to be set up in advance and they have limits on how many you can register.
Start With the Question, Not the Report
A useful custom report begins with a plain question. Which landing pages produce the most enquiries? Where do visitors drop out of the contact process? Which traffic sources bring people who spend the longest on the site?
Write the question down before you touch the interface. Then decide which dimensions and metrics answer it. A report with one clear question is far more useful than a dashboard packed with everything.
Building an Exploration Step by Step
Open Explore and start a blank exploration. Choose a technique such as the free form table, which is the most common and the easiest to read. Add the dimensions that describe what you are looking at, such as page path or session source. Then add the metrics that measure it, such as sessions, engaged sessions, or key events.
Use filters to narrow the view. A filter on a specific landing page group or a particular traffic source can turn a crowded table into a clear answer. Set the date range carefully, because comparing a busy month with a quiet one can mislead you.
Segments Show You Who Behaves Differently
Segments let you compare groups of users. You might compare visitors who came from search with those who came from social, or mobile users with desktop users. Each segment shows the same metrics side by side, which makes differences easy to spot.
Be careful with very small segments. A group of ten visitors can swing wildly from one week to the next, so treat early patterns as hints rather than conclusions until you have more data.
Custom Dimensions Make Your Own Data Visible
If your site sends information that GA4 does not show by default, such as a plan type, a product category, or a form name, you can register it as a custom dimension. Once registered, it appears in reports and explorations just like a built-in field.
Plan these carefully. Register only what you will actually use, and name them clearly so the team knows what each one means. Changing a custom dimension later can mean the historical data does not line up with the new setup.
Keep Reports Consistent Across the Team
Custom reports are only helpful if everyone reads them the same way. Agree on naming conventions for reports and dimensions. Write a short note explaining what each report is for and how often it should be checked.
Share the saved reports in the Library so the whole team sees the same view. This avoids a situation where three people each build a slightly different version and argue about which numbers are right.
Checking Your Numbers
Before you trust a custom report, compare a few numbers against the standard reports. If the totals are wildly different, check the date range, the property, and any filters you applied. Small differences are normal, because explorations and standard reports can process data in different ways.
Accurate conversion tracking matters here too. If your key events are not set up properly, every custom report built on them will be misleading. Our guide on importing custom conversions from Google Ads to GA4 explains how to bring conversions across cleanly.
Turn Reports Into Decisions
A report is only worth building if it changes something. After you check a report, write down one action it suggests. Maybe a landing page needs a clearer button. Maybe a campaign needs a new audience. Maybe a blog topic is bringing the wrong kind of visitor.
Review the same reports on a schedule, such as monthly, and note whether the action worked. Over time, you build a habit of using data rather than just collecting it.
Export and Share Beyond GA4
Sometimes the report needs to live somewhere else, such as a team planning tool or a spreadsheet. GA4 lets you export data, and it can also feed other tools through its API. If you want to pull summaries into a tool like Airtable, our article on connecting GA4 to Airtable looks at the options.
Common Mistakes to Avoid
People often build too many reports, which leads to confusion and wasted time. Others use very wide date ranges that hide recent changes, or compare periods of different lengths without noticing. Some forget to check whether conversions are firing at all before building reports on them.
Keep the set small, keep the date ranges fair, and check the foundations before you build on them.
A Simple Starter Set
Start with three reports. The first shows which pages bring visitors and which of those visitors take a key action. The second compares traffic sources by engagement and conversions. The third tracks a single important funnel, such as enquiry or checkout, from first visit to completion.
Once those three are reliable, add more only when a real question comes up.
The Bottom Line
Custom reports in GA4 turn general data into answers for your own business. Use the Library to tidy the standard views, Explorations for deeper questions, and custom dimensions for information the site sends that GA4 does not show by default. Start with a clear question, keep the set small, and make sure the numbers are trustworthy before you act on them.
For official guidance on building explorations and reports, visit the Google Analytics Help Centre.